35. Server management part 2: Monitoring
35.1. Counter
iFun Engine reveals what happens inside a game server through a counter. You can use this to make your own external monitoring tool. iFun Engine provides an iFun Engine dashboard where you can monitor various types of data using the counter. (For more details, please see iFun Engine Dashboard.)
35.1.1. Counter reading and writing
35.1.1.1. Counter writing
You can use the following 3 functions to write counter values.
Note
There is no other registration function, and the counter is registered if the above writing function is invoked.
35.1.1.2. Counter reading
Created counters can read inside the server in integer, string, or double format. Please see Reading the counter externally in REST format for more on reading the counter externally.
35.1.1.3. Example of counter use
1 2 3 4 5 6 7 8 9 10 11 12 13 14 15 16 17 18 19 | #include <funapi.h>
void example(){
UpdateCounter("server", "item/count", 150);
UpdateCounter("server", "monster/count", "The number of monsters", 150);
IncreaseCounterBy("server", "item/count", 1);
DecreaseCounterBy("server", "item/count", 1);
int64_t item_count = ReadCounterAsInteger("server", "item/count");
BOOST_ASSERT(item_count == 150);
UpdateCounter("server", "connection_per_second", 77.7);
UpdateCounter("billing", "purchase_per_second", 7.1);
}
|
1 2 3 4 5 6 7 8 9 10 11 12 13 14 15 16 17 18 | using funapi;
public void Example()
{
Counter.Update ("server", "item/count", 150);
UpdateCounter("server", "monster/count", "The number of monsters", 150);
Counter.Increase ("server", "item/count", 1);
Counter.Decrease ("server", "item/count", 1);
Int64 item_count = Counter.ReadInteger ("server", "item/count");
Counter.Update ("server", "connection_per_second", 77.7);
Counter.Update ("billing", "purchase_per_second", 7.1);
}
|
35.1.1.4. Reading the counter externally in REST format
Counters defined as above can be accessed as follows.
-
GEThttp://localhost:8014/v1/counters/¶ Retrieves a list of all counter categories.
-
GEThttp://localhost:8014/v1/counters/funapi/¶ Displays a list of counters in the reserved iFun Engine category.
-
GEThttp://localhost:8014/v1/counters/server/item/count/¶ Reads the counter value called
item/countin the programmer-made server category. This is150in the example above.
-
GEThttp://localhost:8014/v1/counters/billing/purchase_per_second/¶ Reads the counter value called
perchase_per_secondin the programmer-made billing category. This is7.1in the example above.
-
GEThttp://localhost:8014/v1/counters/server/monster/count/description/¶ Reads the counter description called
monster/countin the programmer-made server category. This is “The number of monsters”` in the example above.Tip
If a description is added to the counter, a clearer definition can be sent to an external operator when connected to an external system.
35.1.2. Counter monitoring
Integer and Double counters can output logs when counter values exceed a particular value.
This helps detect rapid changes in items inside a game, for example.
The following example shows a warning message when a user’s hourly gold is calculated using a counter and exceeds 100,000.
35.1.2.1. Counter monitoring example
1 2 3 4 5 6 7 8 9 10 11 12 13 14 15 16 17 | void OnResetGoldCounterTimerExpired(const Timer::Id &, const WallClock::Value &) {
UpdateCounter("game", "gold_per_hour", 0);
}
void Install() {
UpdateCounter("game", "gold_per_hour", 0);
MonitorCounter("game", "gold_per_hour", 100000);
Timer::ExpireRepeatedly(WallClock::FromSec(3600), OnResetGoldCounterTimerExpired);
}
// Assume this function is called when user pick gold.
void PickGold(int64_t gold) {
IncreaseCounterBy("game", "gold_per_hour", gold);
}
|
1 2 3 4 5 6 7 8 9 10 11 12 13 14 15 16 17 18 19 | void OnResetGoldCounterTimerExpired(UInt64 timer_id, DateTime clock)
{
Counter.Update ("game", "gold_per_hour", 0);
}
void Install()
{
Counter.Update ("game", "gold_per_hour", 0);
Counter.Monitor ("game", "gold_per_hour", 100000);
Timer.ExpireRepeatedly (WallClock.FromSec (3600), OnResetGoldCounterTimerExpired);
}
// Assume this function is called when user pick gold.
void PickGold(UInt64 gold)
{
Counter.Increase ("game", "gold_per_hour", gold);
}
|
Note
To register a monitor, you need to invoke UpdateCounter(),
IncreaseCounterBy(), and DecreaseCounterBy() as in the example
to preregister the counter.
The following log is now output if gold exceeds 100,000 per hour.
W0818 11:03:06.520730 18324 counter.cc:160] The 'gold_per_hour of game' counter exceeded threshold: value=123456, threshold=100000
35.1.2.2. Outputting monitoring logs
To prevent an excessive number of logs, a log is not output each time the input threshold value is exceeded in MonitorCounter().
Rather, the counter value is checked every second when input in MANIFEST.json -> counter_monitoring_interval_in_sec and a log is output.
35.1.2.3. Engine default counter monitoring
Counters that monitor by default on the engine are as follows.
35.1.2.3.1. Event
event_queue_length: Length of event queue waiting to be processed Monitors to check whether a specifiedthresholdvalue is exceeded.
35.1.2.3.2. ORM
outstanding_fetch_query: Number of queries for objects to be fetched awaiting processing Monitors to check whether a specifiedthresholdvalue is exceeded.
outstanding_update_query: Number of queries for objects to be updated awaiting processing Monitors to check whether a specifiedthresholdvalue is exceeded.
Tip
This counter’s warning threshold can be changed in MANIFEST.json.
35.1.3. Default counter list
The following is a list of counters provided by the engine by default.
35.1.3.1. process
This counter searches currently running iFun Engine process data.
Counter name
Description
vsz
Virtual memory size used by processes.
cpu
CPU usage by processes.
nivcsw
Number of times task is not ended before context switching.
nswap
This field is currently not in use.
oublock
Number outputting file system.
minflt
Number of minor page faults.
idrss
Unshared RSS size.
isrss
Unshared stack size.
ixrss
Shared RSS memory size.
nsignals
Signal number receiving response.
majflt
Number of major page faults.
maxrss
Maximum RSS value used.
msgsnd
Number of IPC messages sent.
msgrcv
Number of IPC responses.
nvcsw
Number of times task ended before context switching.
stime
Total time process run in kernel mode.
updated
Last updated UTC time.
utime
Total time process run in user mode.
inblock
Number input to file system.
refresh_interval
Cycle (seconds) for counter to refresh.
35.1.3.2. os
This counter searches server OS data.
Counter name
Description
procs
Total number of running processes.
freeswap
Usable memory size (bytes).
bufferram
Memory size (bytes) used with buffer.
load15
Load average over 15 minutes.
totalswap
Total memory size (bytes).
load5
Load average over 5 minutes.
load1
Load average over 1 minute.
updated
Last updated UTC time.
uptime
Time (seconds) from server booting until now.
freeram
Free RAM size (bytes).
cpus
Number of CPU cores.
totalram
Total RAM size (bytes).
refresh_interval
Cycle (seconds) for counter to refresh.
sharedram
Total shared memory size (bytes).
type
OS type.
35.1.3.3. funapi
Searches server engine data.
Counter name
Description
concurrent_user
Number of users accessing the server. You need to use
AccountManagerto handle logins.For more details, please see 클라이언트와 아이펀 세션 연동 / 해제 (로그인 / 로그아웃).sessions
Number of sessions accessing the server.
sessions.by-tag.<tagname>
Number of sessions accessing the server and tagged as the <tagname>.
object_database_stat
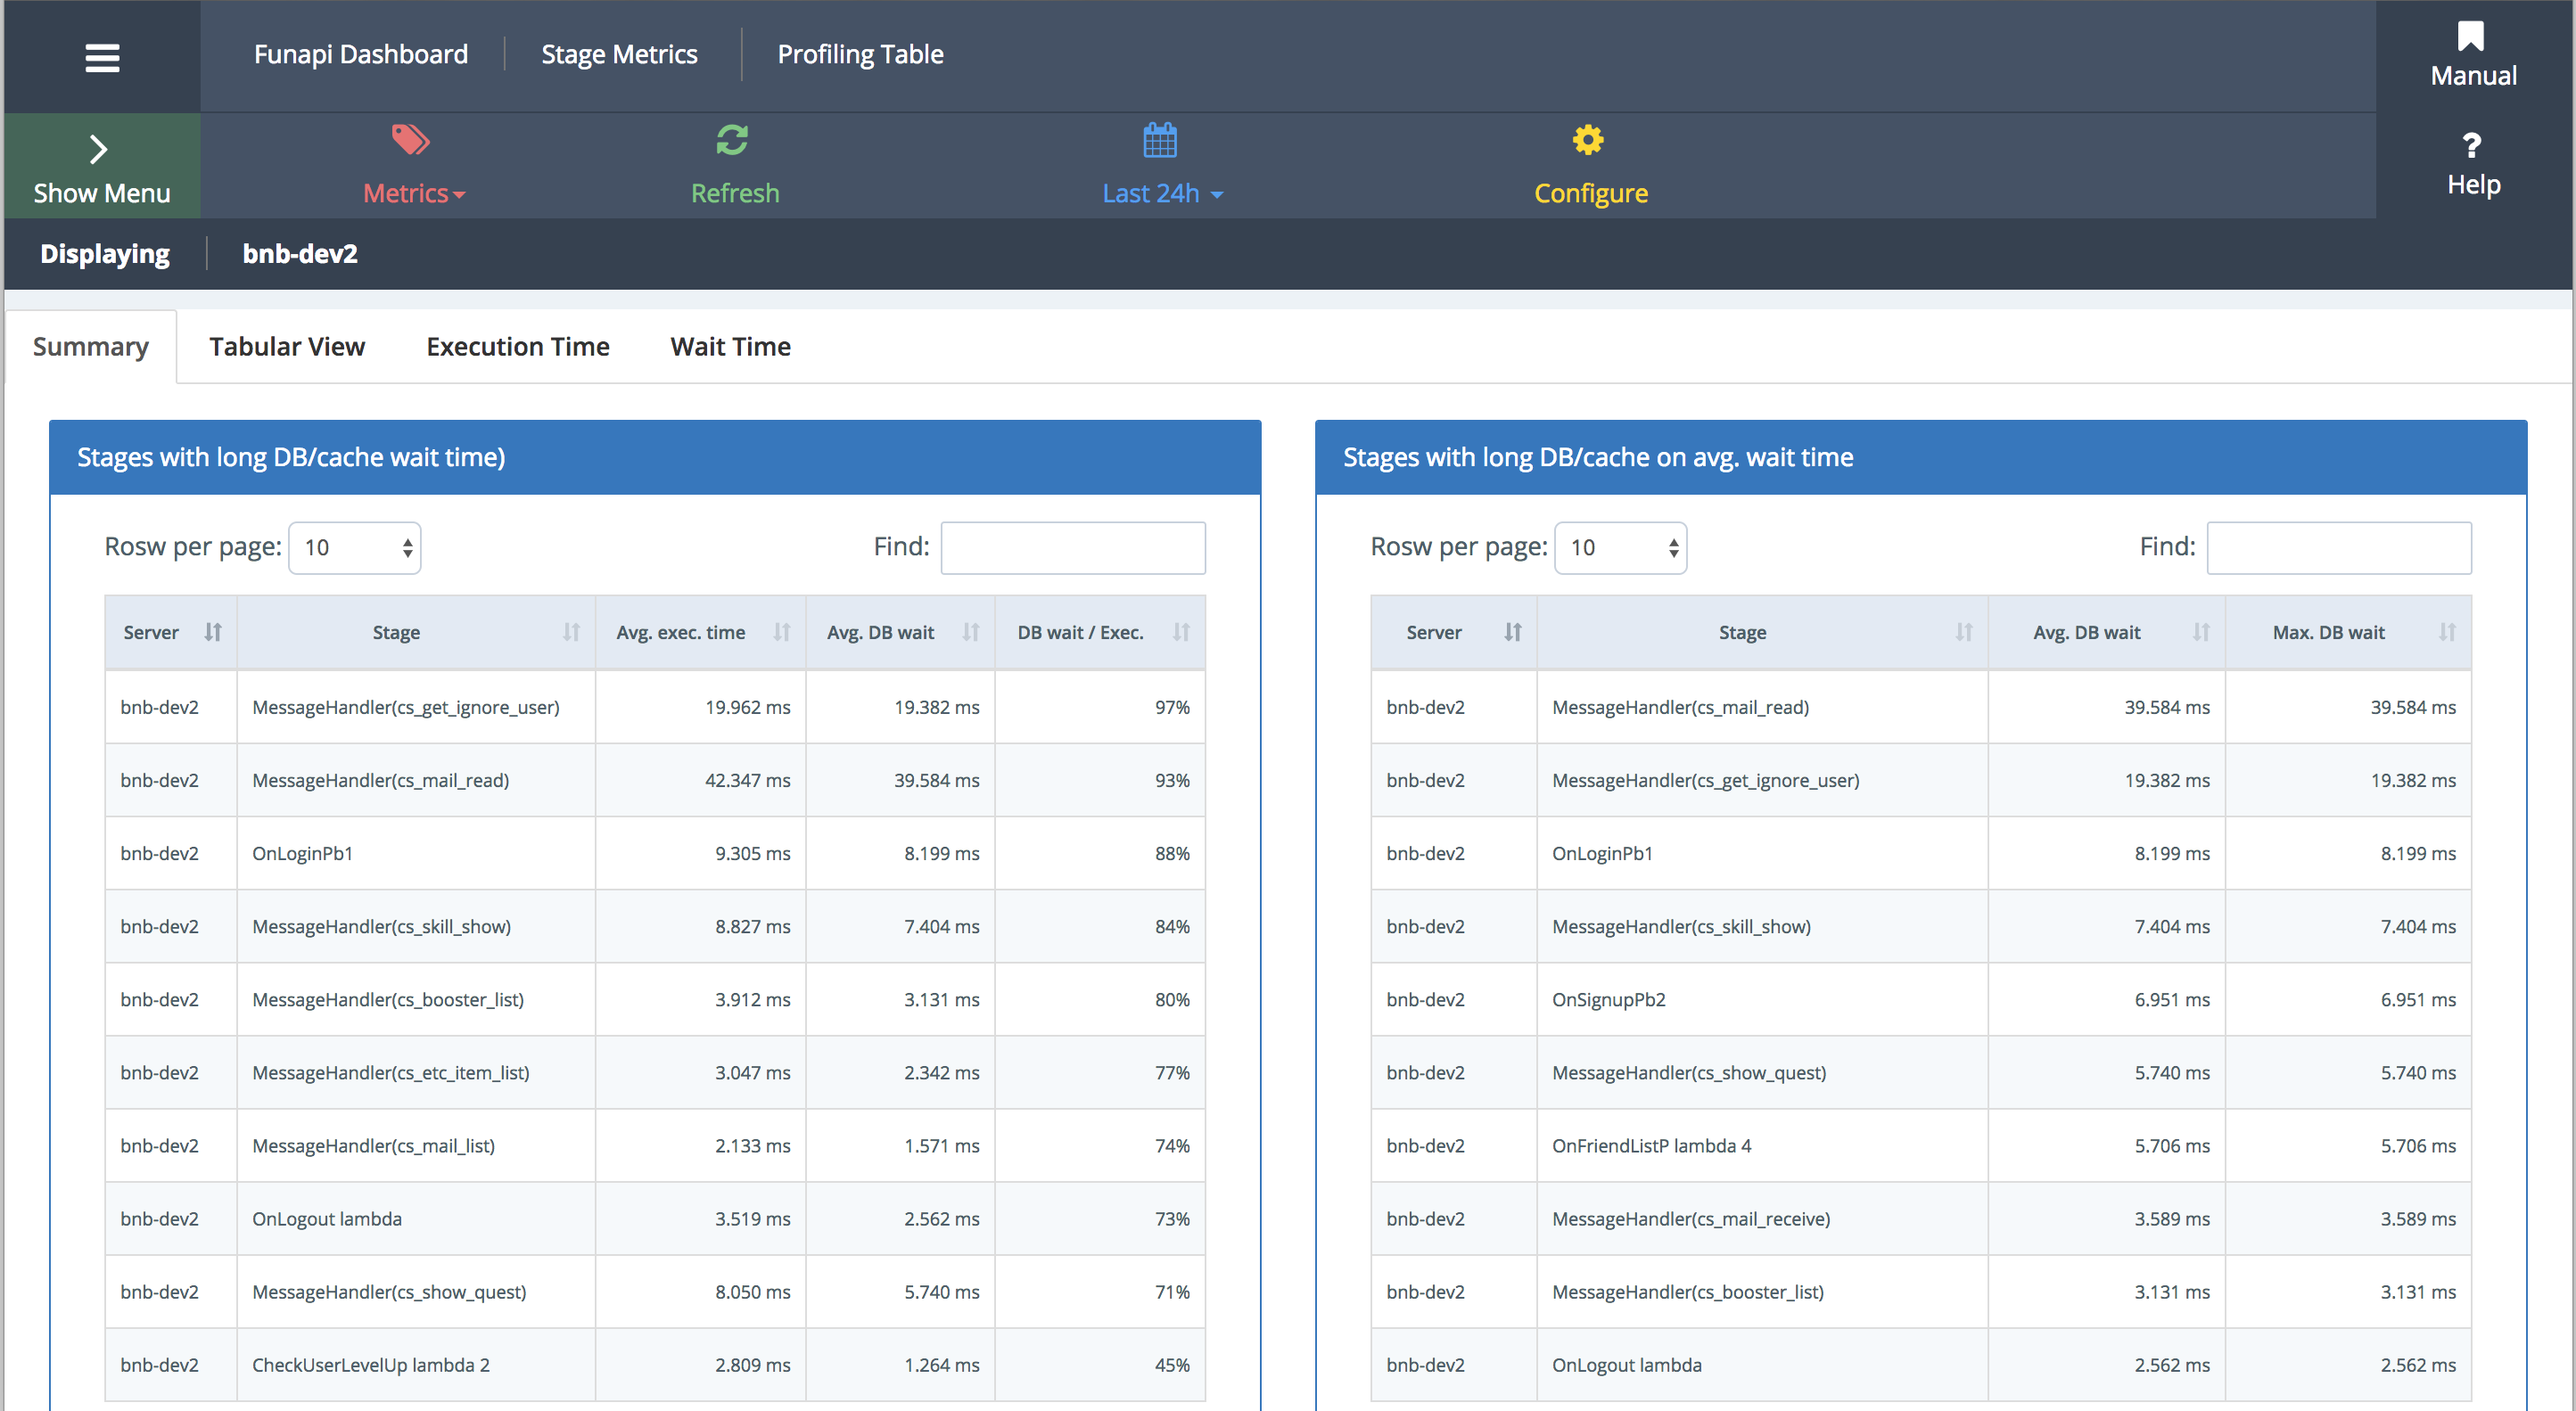
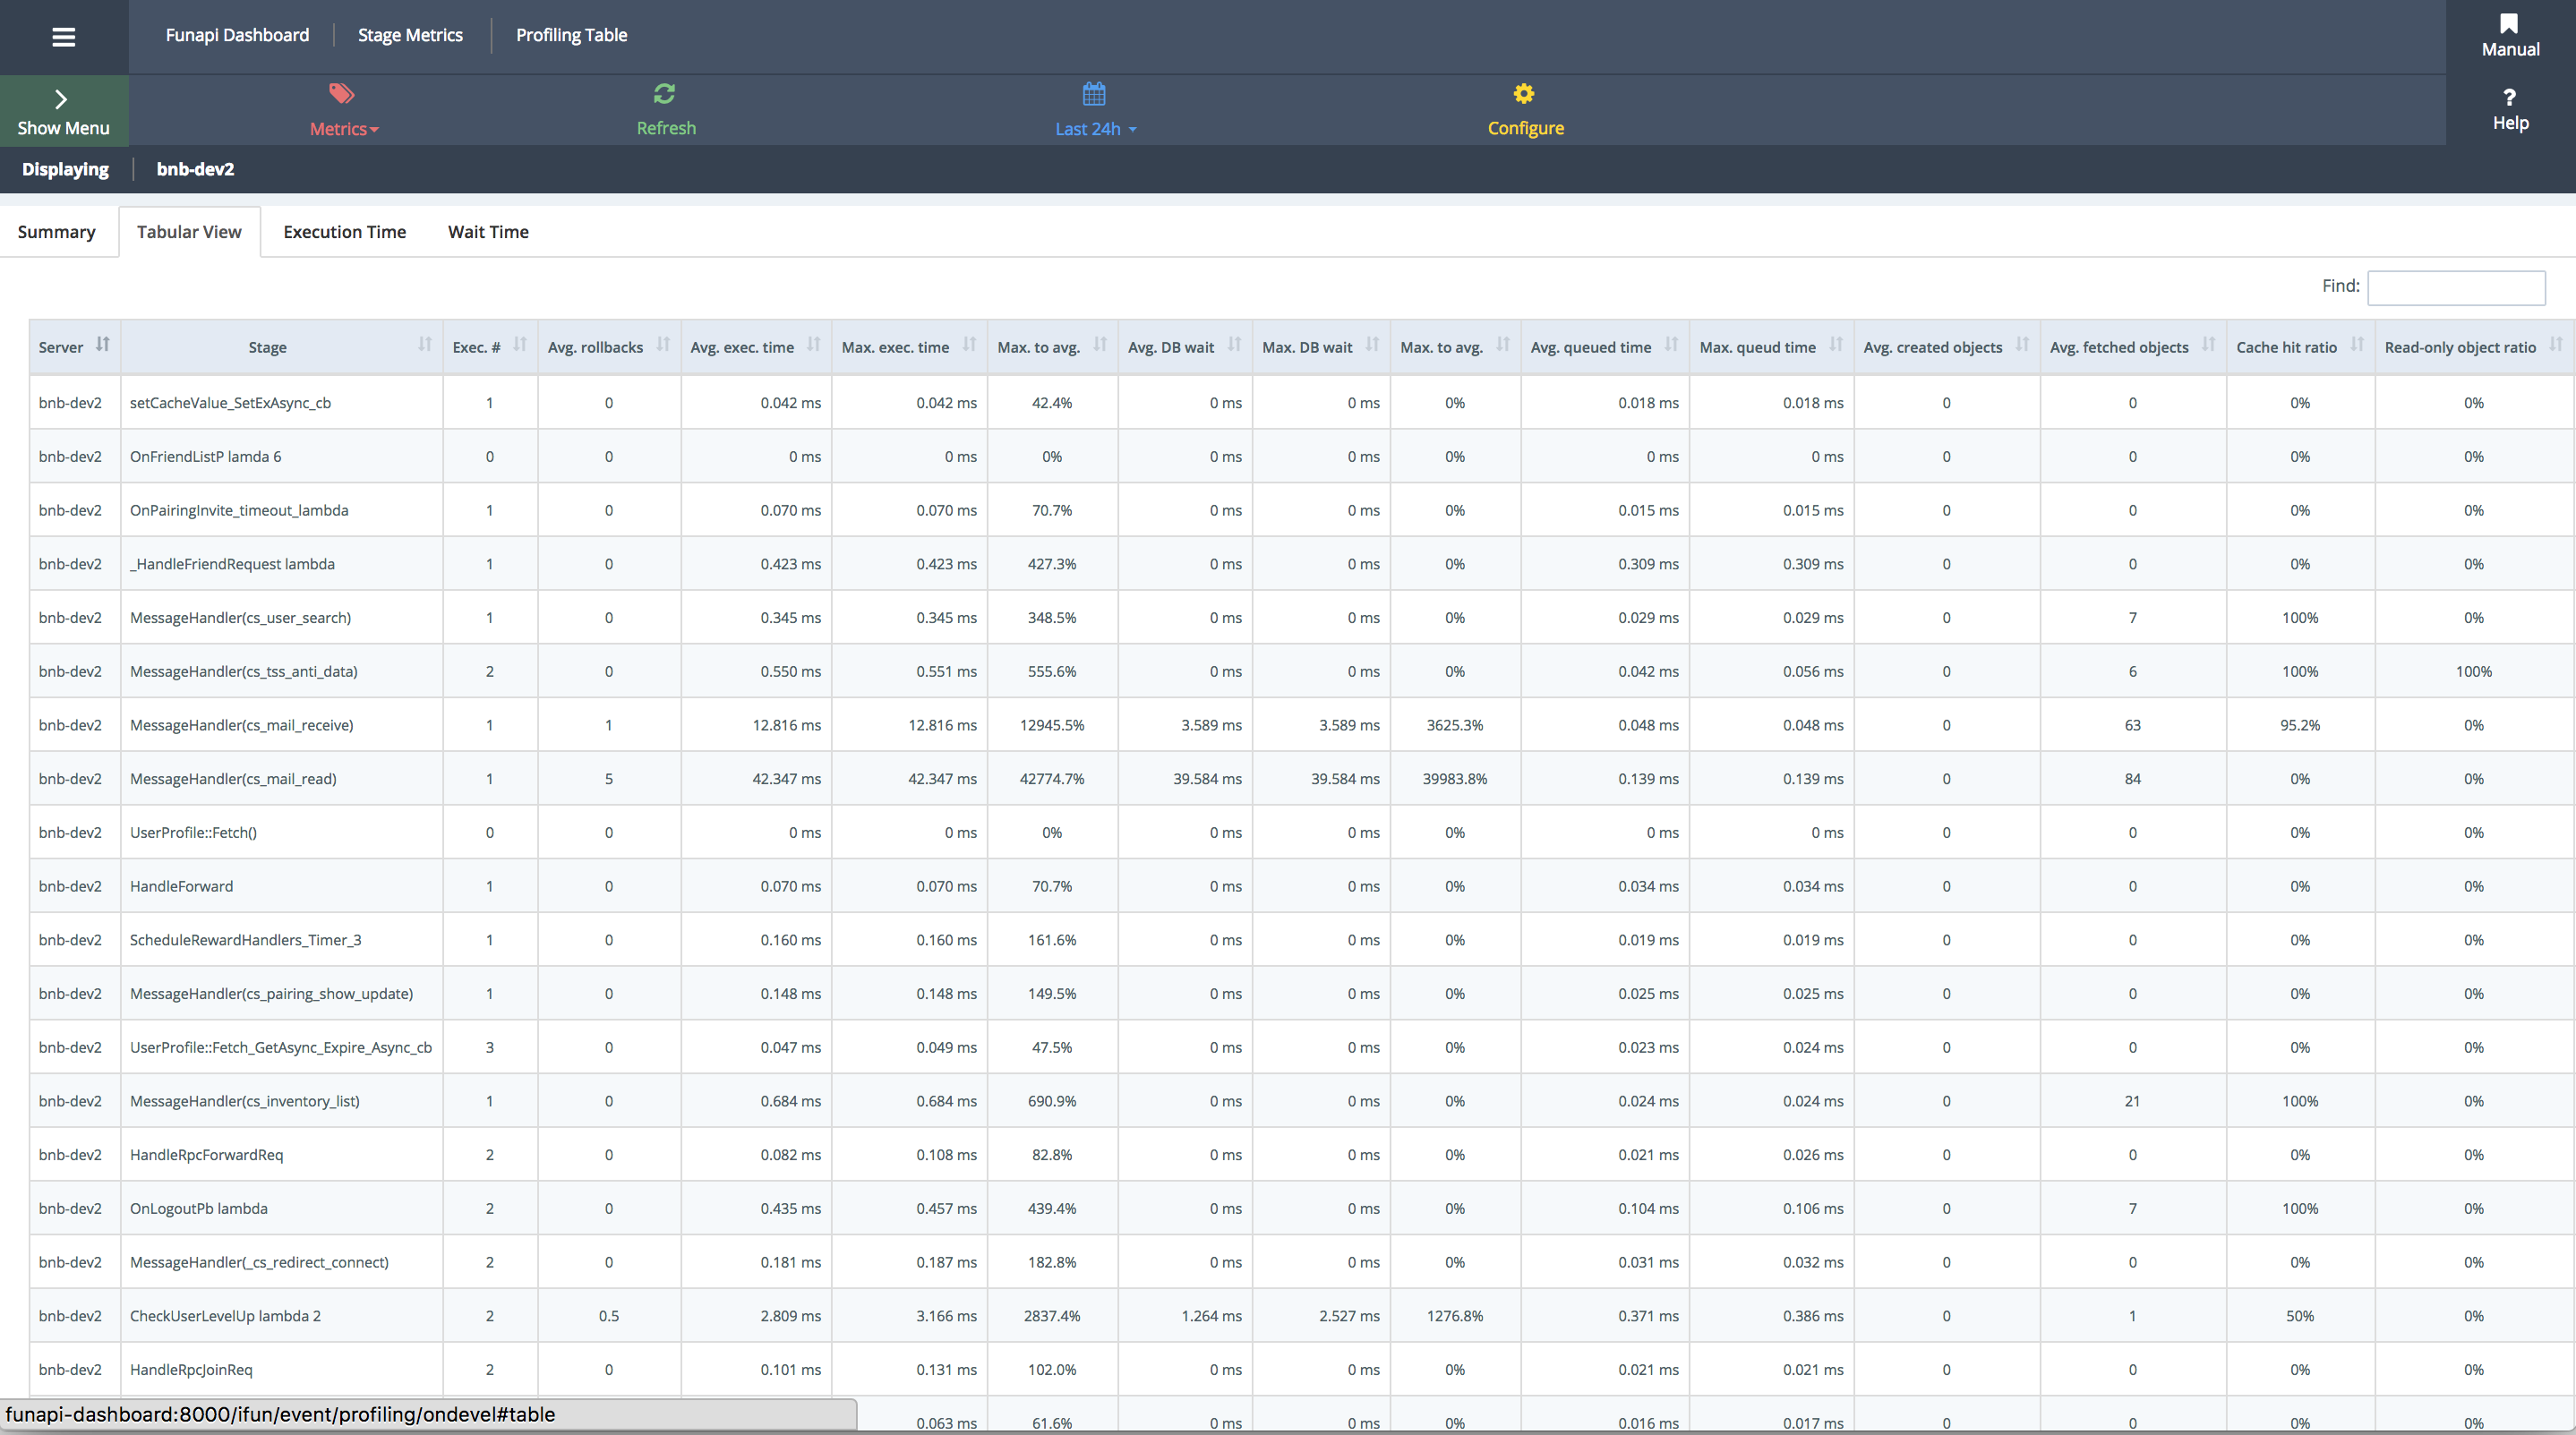
Statistics for query handling time for objects in each DB. For more details, see (Advanced) Profiling The ORM.
object
Searches the number of objects cached on the server and number of read/write queries in the queue.
rpc_stat
RPC performance statistics.
zookeeper_stat
Zookeeperhandling time statistics used to share objects. For more details, see Zookeeper profiling.event/performance/queue
Searches for server event influx, throughput, and number of queued events.
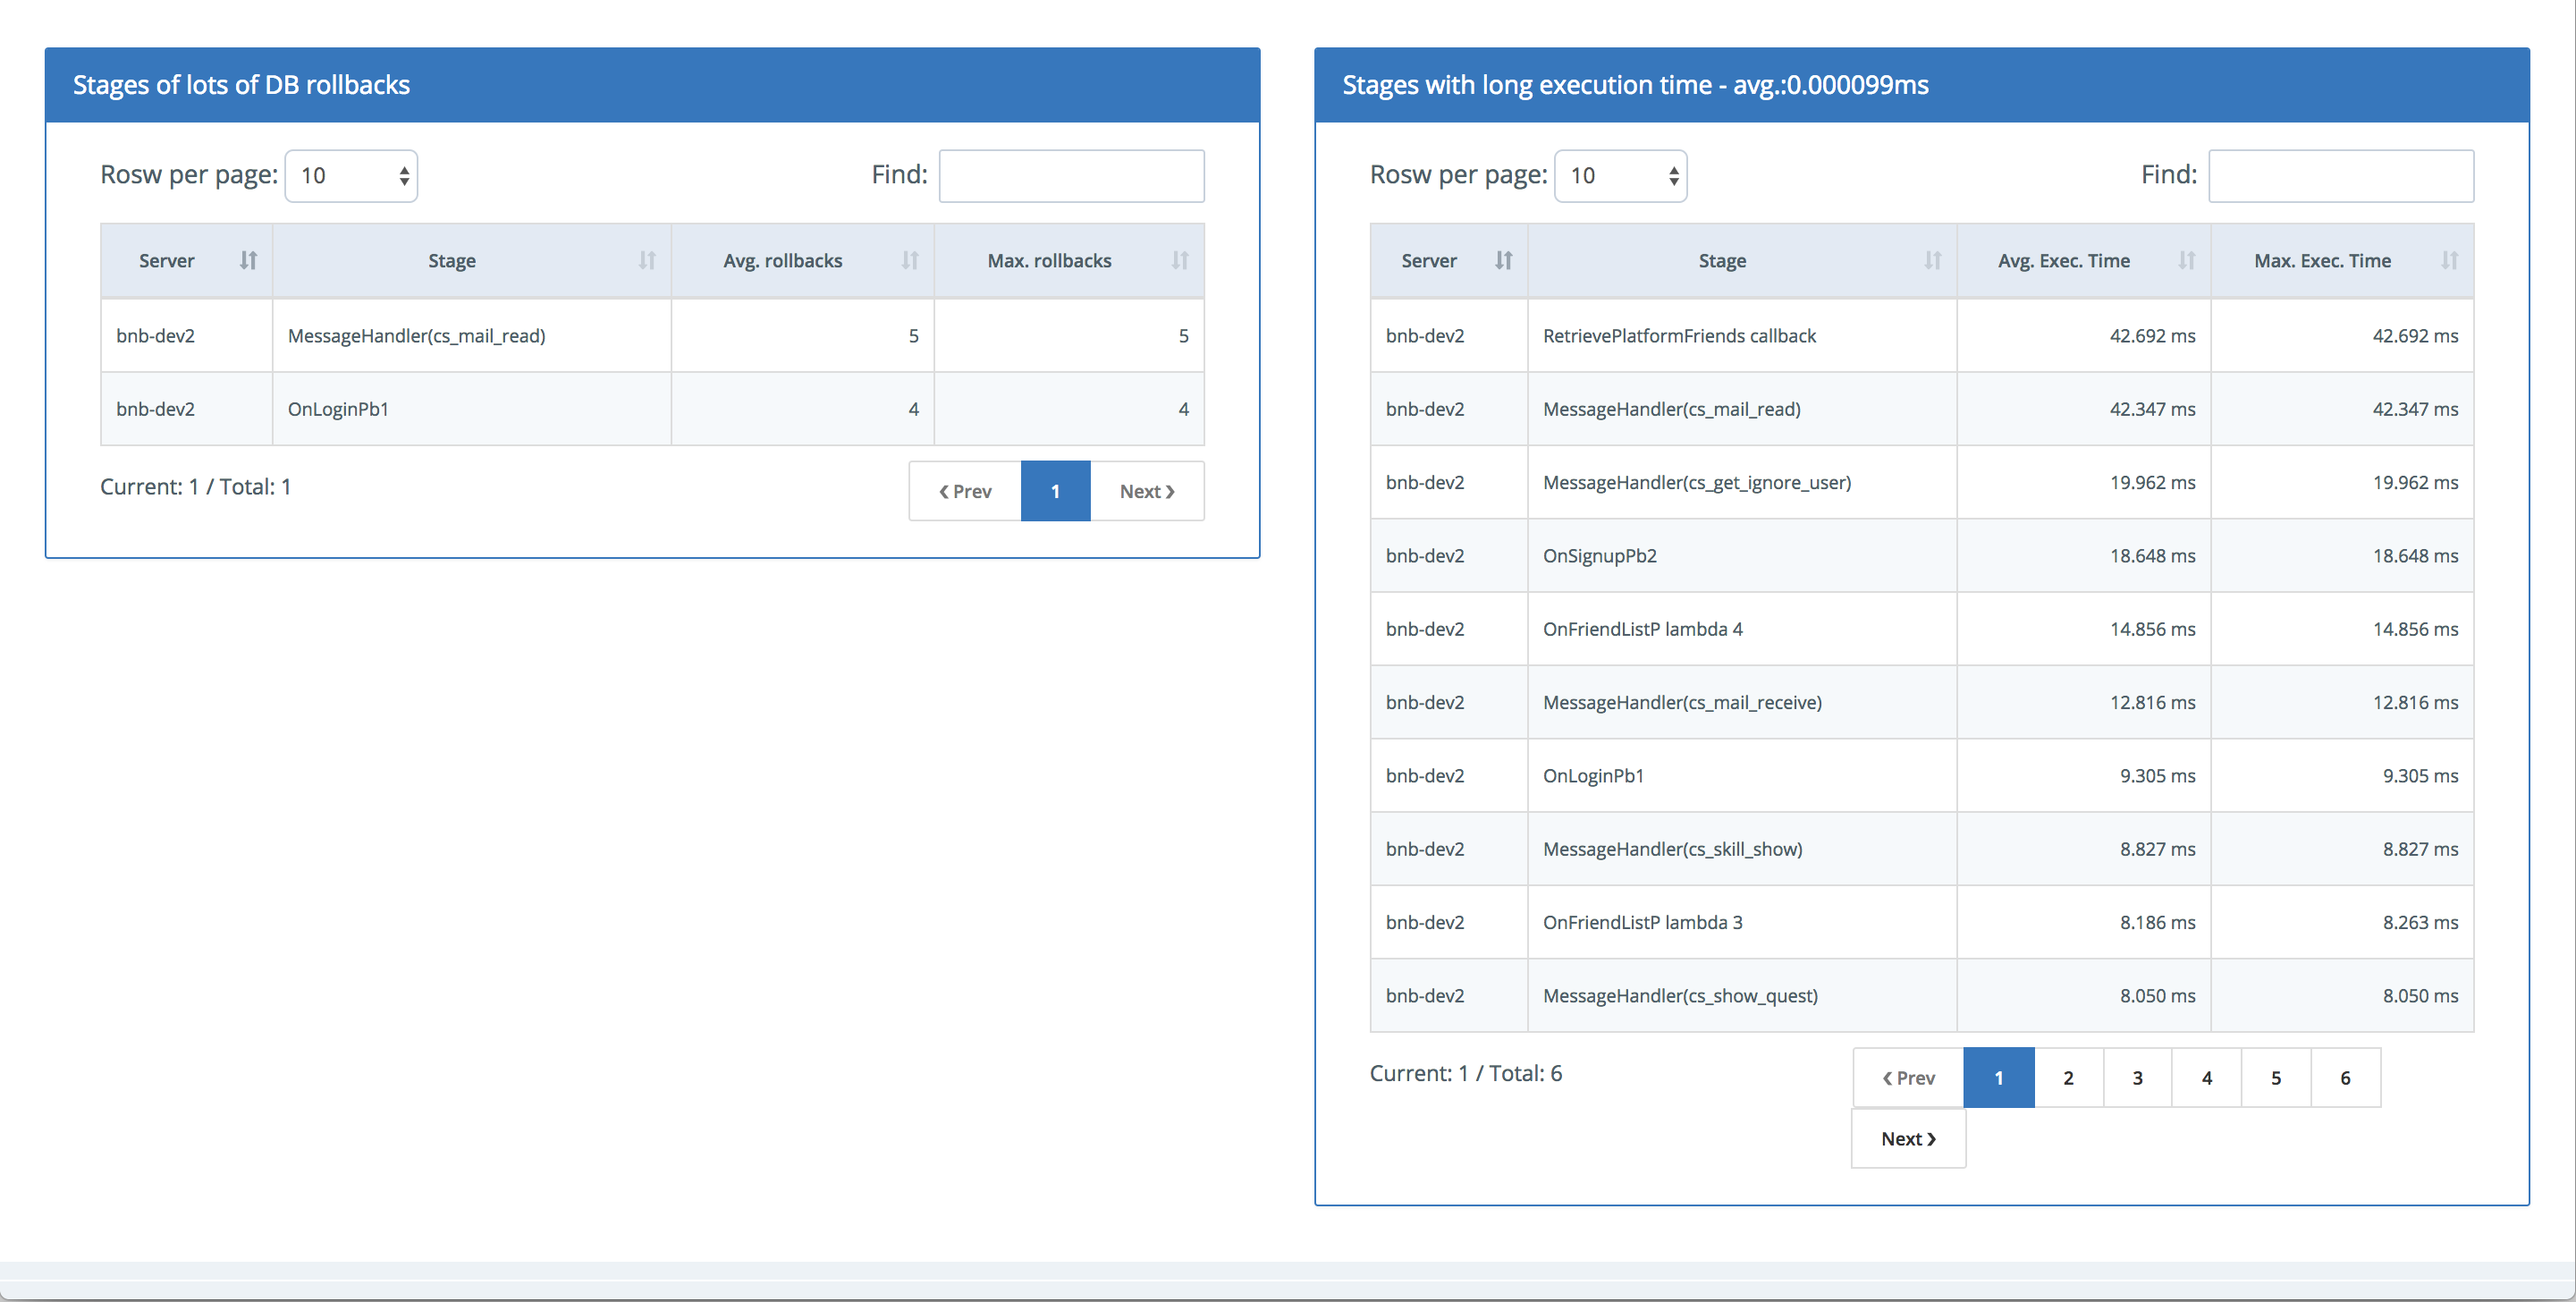
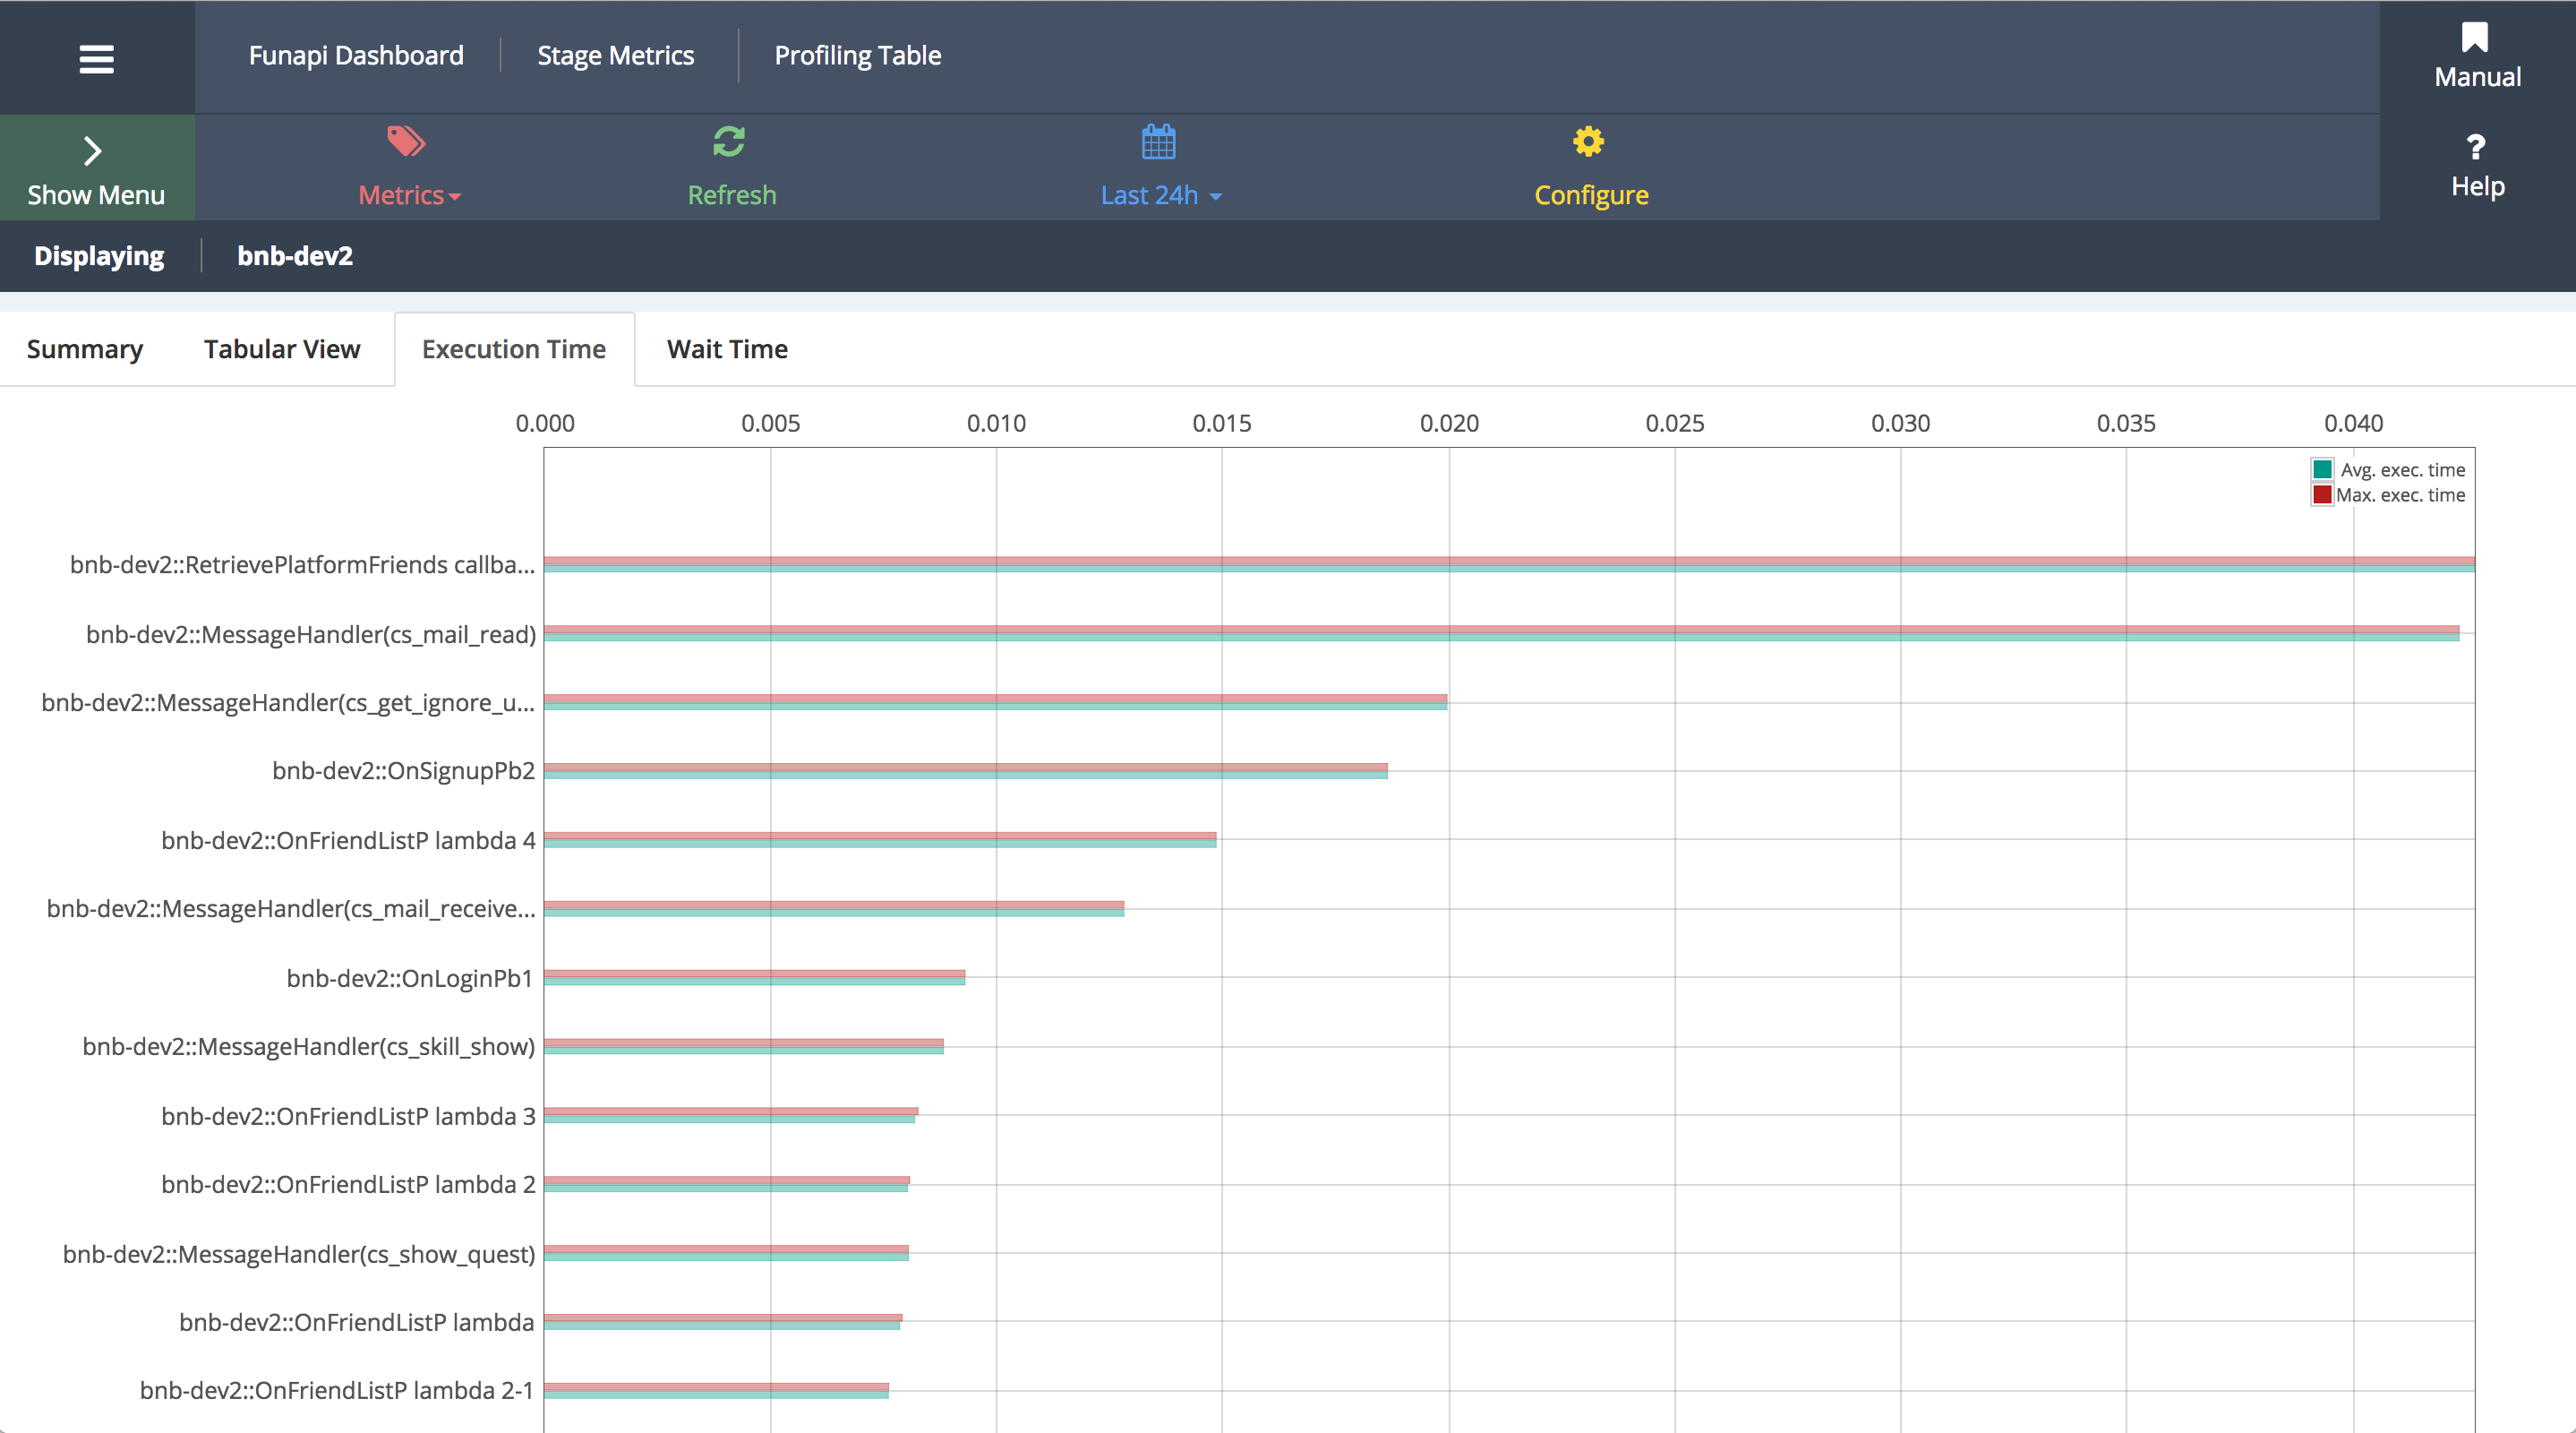
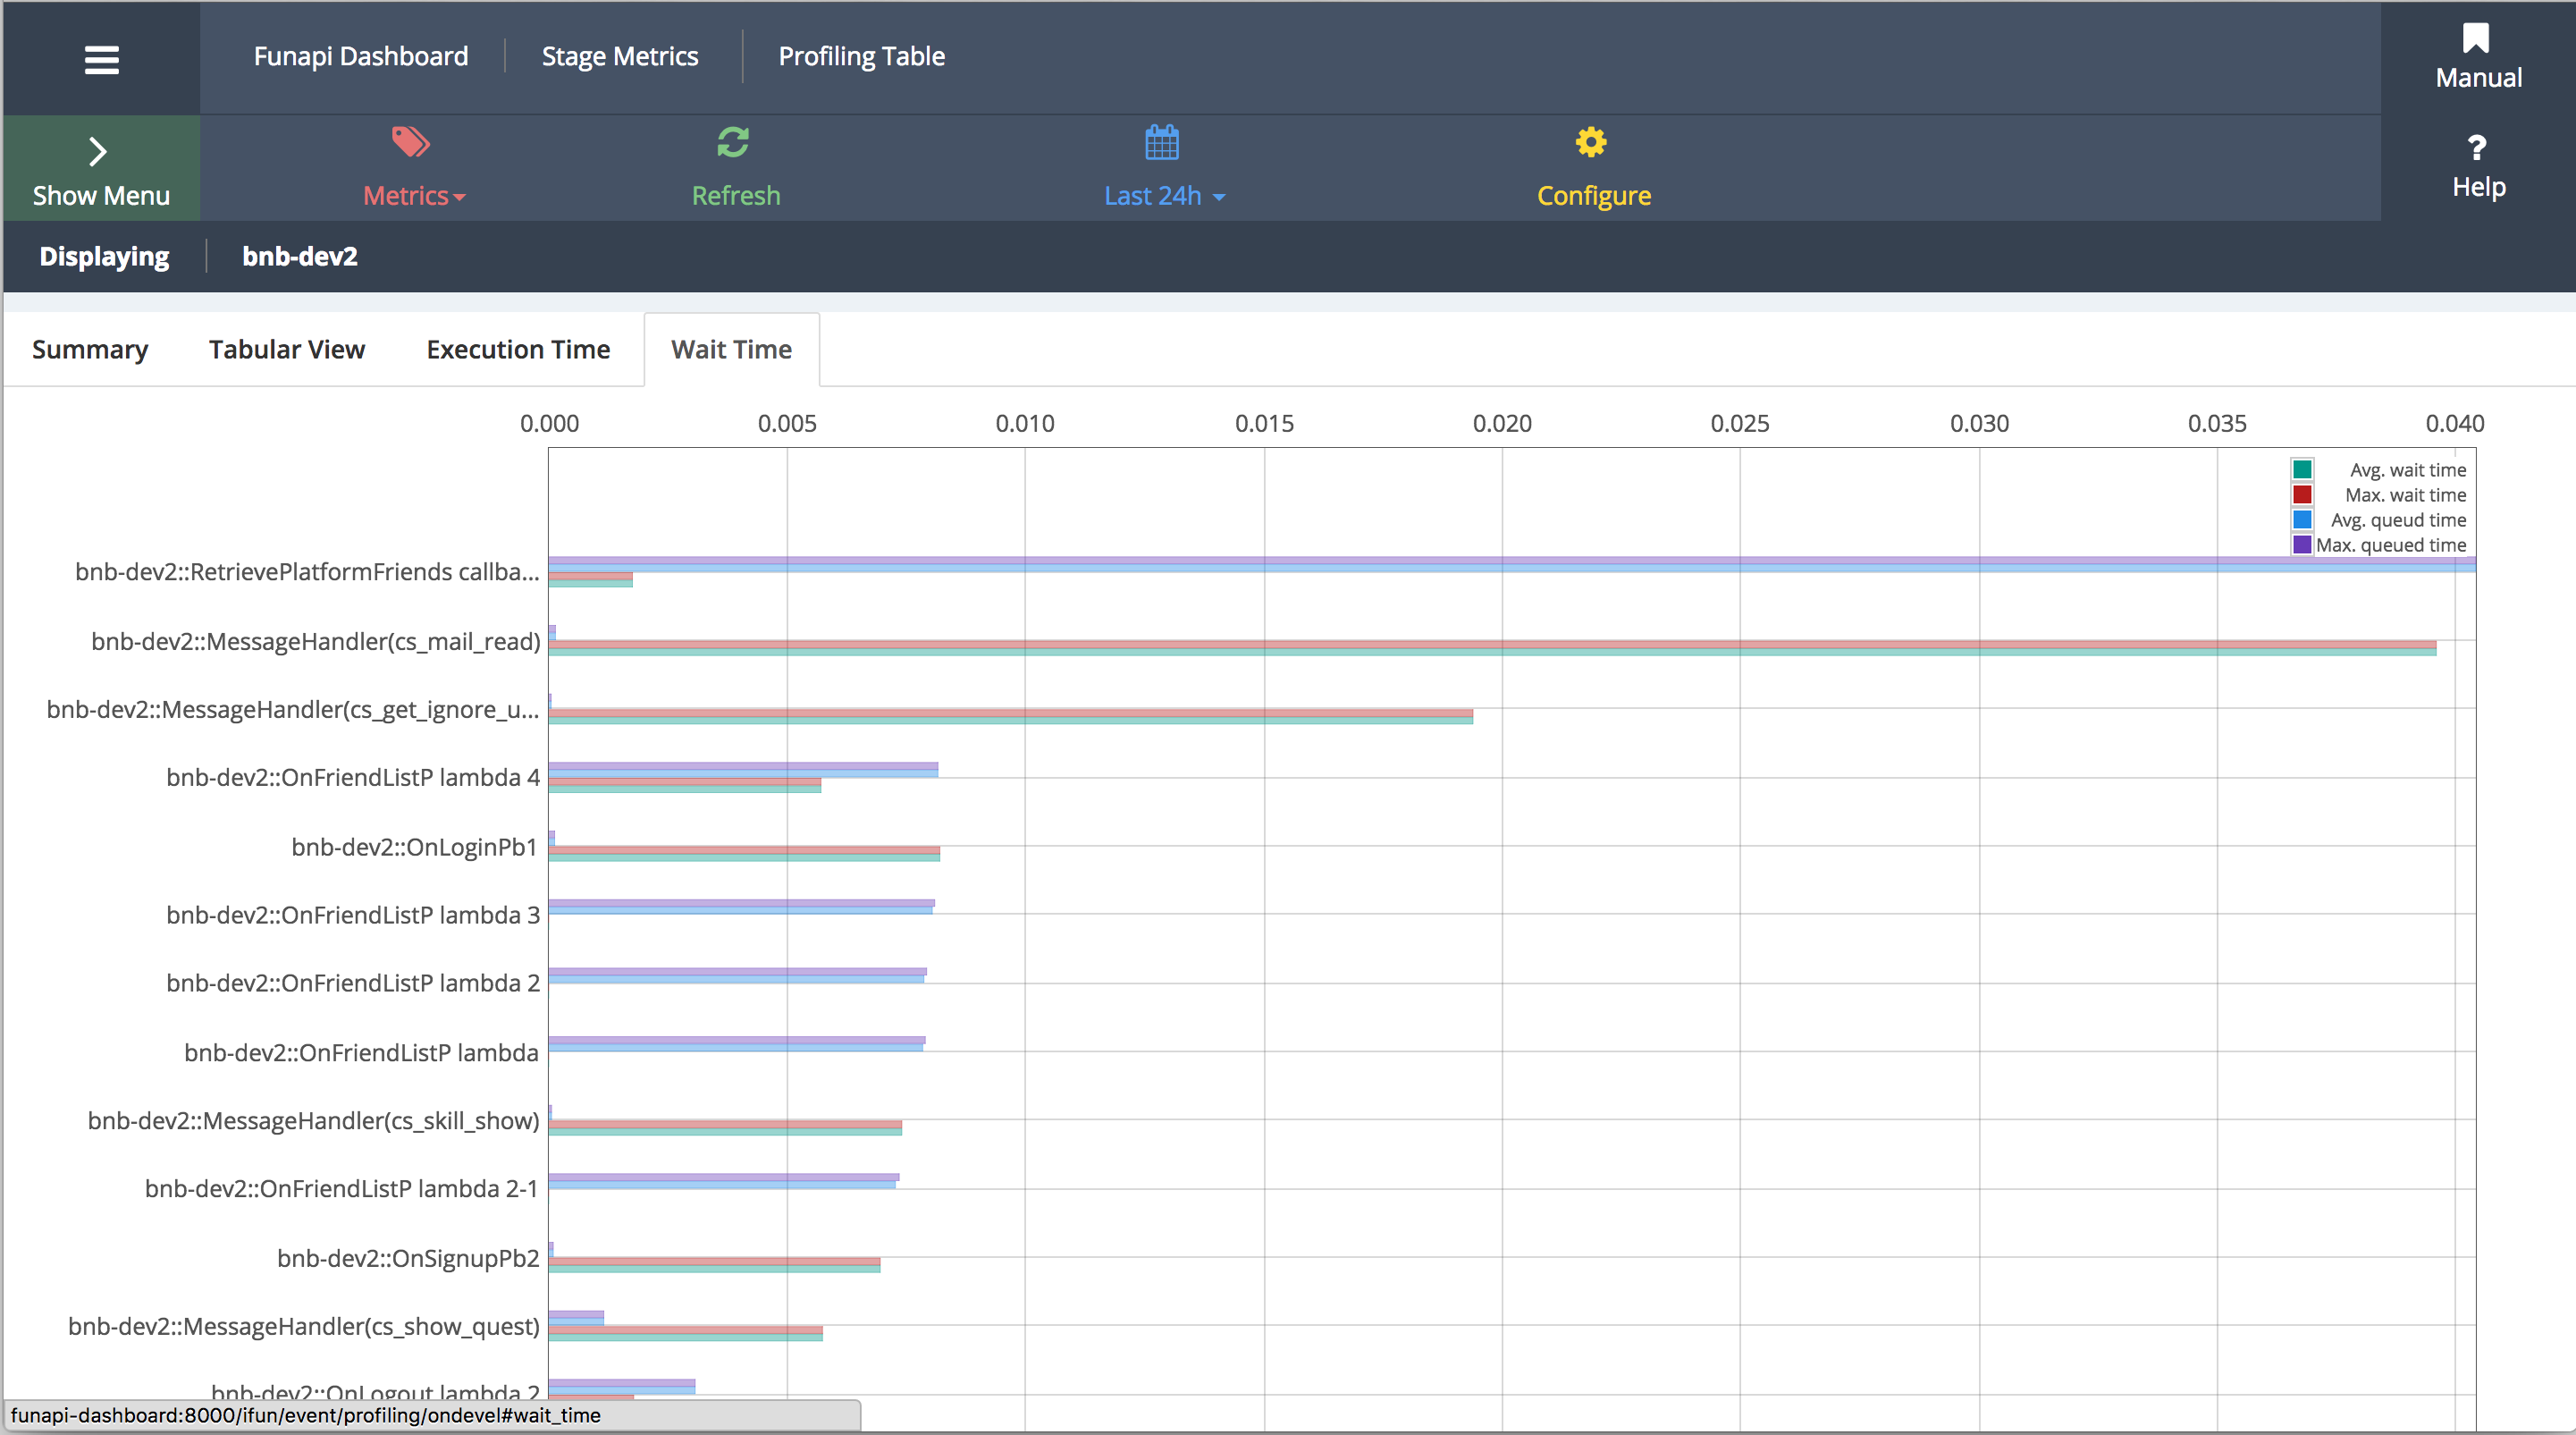
event/profiling/all
Statistics for handling time per event. For more details, see Event profiling: details.
event/profiling/summary
Overall event handling time statistics. For more details, see Event profiling: summary.
event/profiling/reset
Resets event profiling.
event/profiling/outstanding
Statistics for events being processed.
35.1.3.4. funapi_object_model
Searches number of cached objects for each model.
35.1.4. (Advanced) Callback counters
You may sometimes need to perform additional calculations to determine counter values or to return multiple values in addition to simply registering and returning numbers.
When an average must be returned, it is common to internally calculate the sum and individual numbers and divide the sum by those individual numbers to return the average.
You can register a callback in the counter for such calculations.
35.1.4.1. Example of callback counter use
1 2 3 4 5 6 7 8 9 10 11 12 13 14 15 16 17 18 19 20 21 22 23 24 | #include <funapi.h>
http::StatusCode OnAverageQueried(
const string &counter_group, // "server" when called
const string &counter_path, // "average_users_per_room" when called.
Json *ret) {
if (total_rooms == 0) {
return http::kNoContent;
}
double average = total_users / total_rooms;
ret->SetDouble(average);
return http::kOk;
}
void example() {
RegisterCallableCounter(
"server",
"average_users_per_room",
"Returns the average number of users per game room",
OnAverageQueried);
}
|
1 2 3 4 5 6 7 8 9 10 11 12 13 14 15 16 17 18 19 20 21 22 23 24 25 | using funapi;
funapi.http.StatusCode OnAverageQueried(
string counter_group, // "server" when called
string counter_path, // "average_users_per_room" when called
JObject ret)
{
if (total_rooms == 0) {
return funapi.http.StatusCode.kNoContent;
}
double average = total_users / total_rooms;
ret->SetDouble(average);
return funapi.http.StatusCode.kOk;
}
void Example()
{
Counter.RegisterCallableCounter (
"server",
"average_users_per_room",
"Returns the average number of users per game room",
OnAverageQueried);
}
|
-
GEThttp://localhost:8014/v1/counters/server/average_users_per_room/¶ When this API is invoked,
OnAverageQueried()is invoked and the average calculated and returned.
35.1.5. Counter parameters
counter_flush_interval_in_sec: Sets the interval in seconds to periodically renew exposed counter values (type=uint64, default=0)
Parameters with configurations that are almost never changed manually
counter_monitoring_interval_in_sec: Interval in seconds to monitor values other than those simply moved out (type=uint64, default=30)
warning_threshold_event_queue_length: Outputs a warning message if the event queue surpasses this value during counter monitoring (type=uint64, default=3000)
warning_threshold_outstanding_fetch_query: Outputs a warning message if the DB reading queue surpasses this value during counter monitoring (type=uint64, default=5000)
warning_threshold_outstanding_update_query: Outputs a warning message if the DB writing queue surpasses this value during counter monitoring (type=uint64, default=5000)
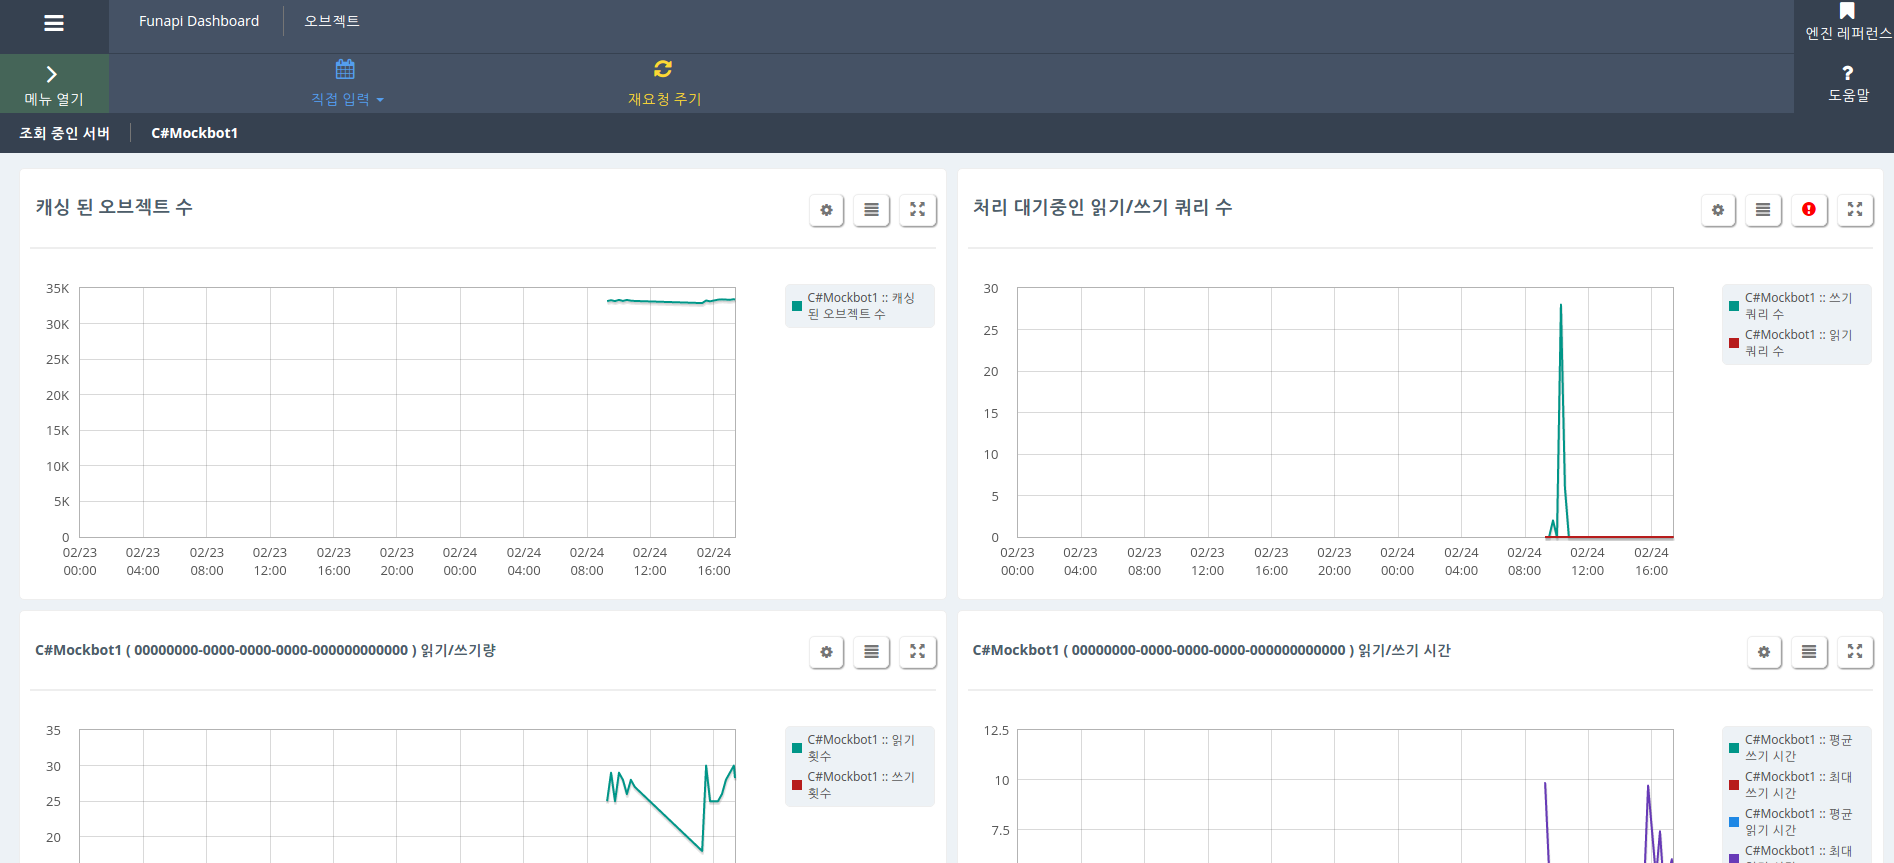
35.2. iFun Engine dashboard
iFun Engine provides a separate dashboard to easily monitor game servers. This dashboard is implemented using iFun Engine Counter. Please refer to the iFun Engine dashboard manual.
The iFun Engine dashboard most notably includes the following features.
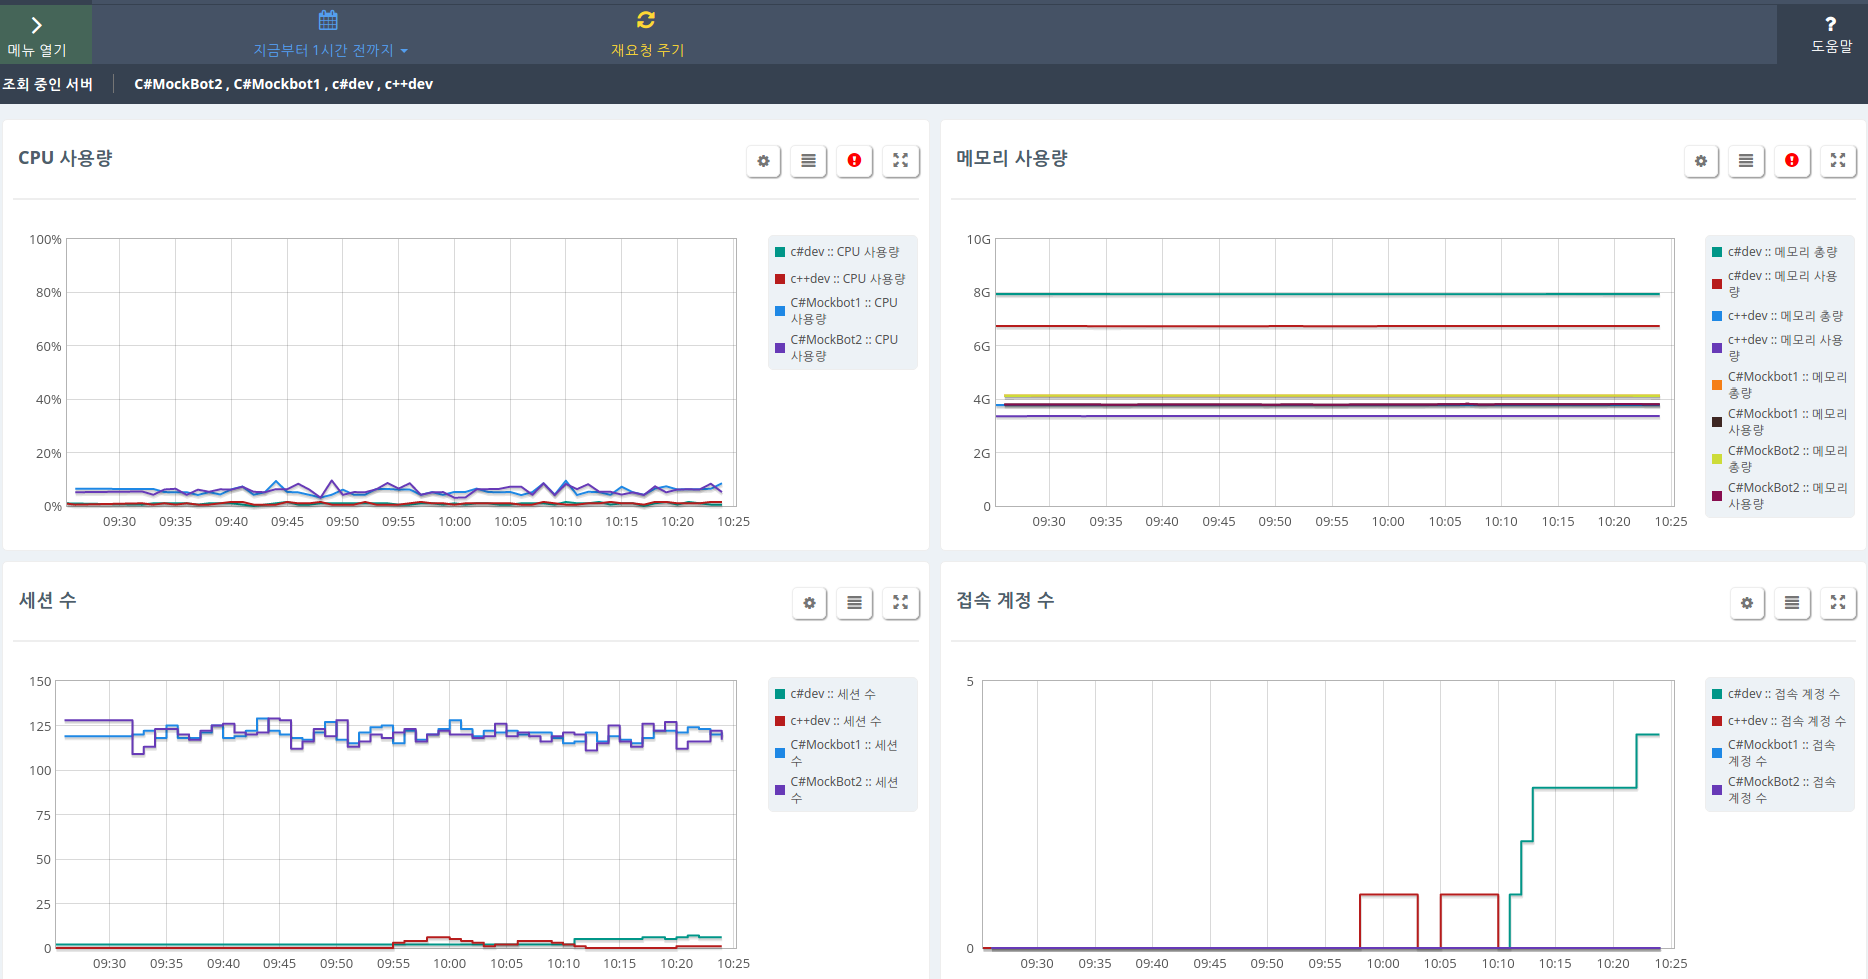
35.2.1. OS-level resource monitoring
CPU, RAM, number of connected sessions, and number of logged in users are displayed as graphs.
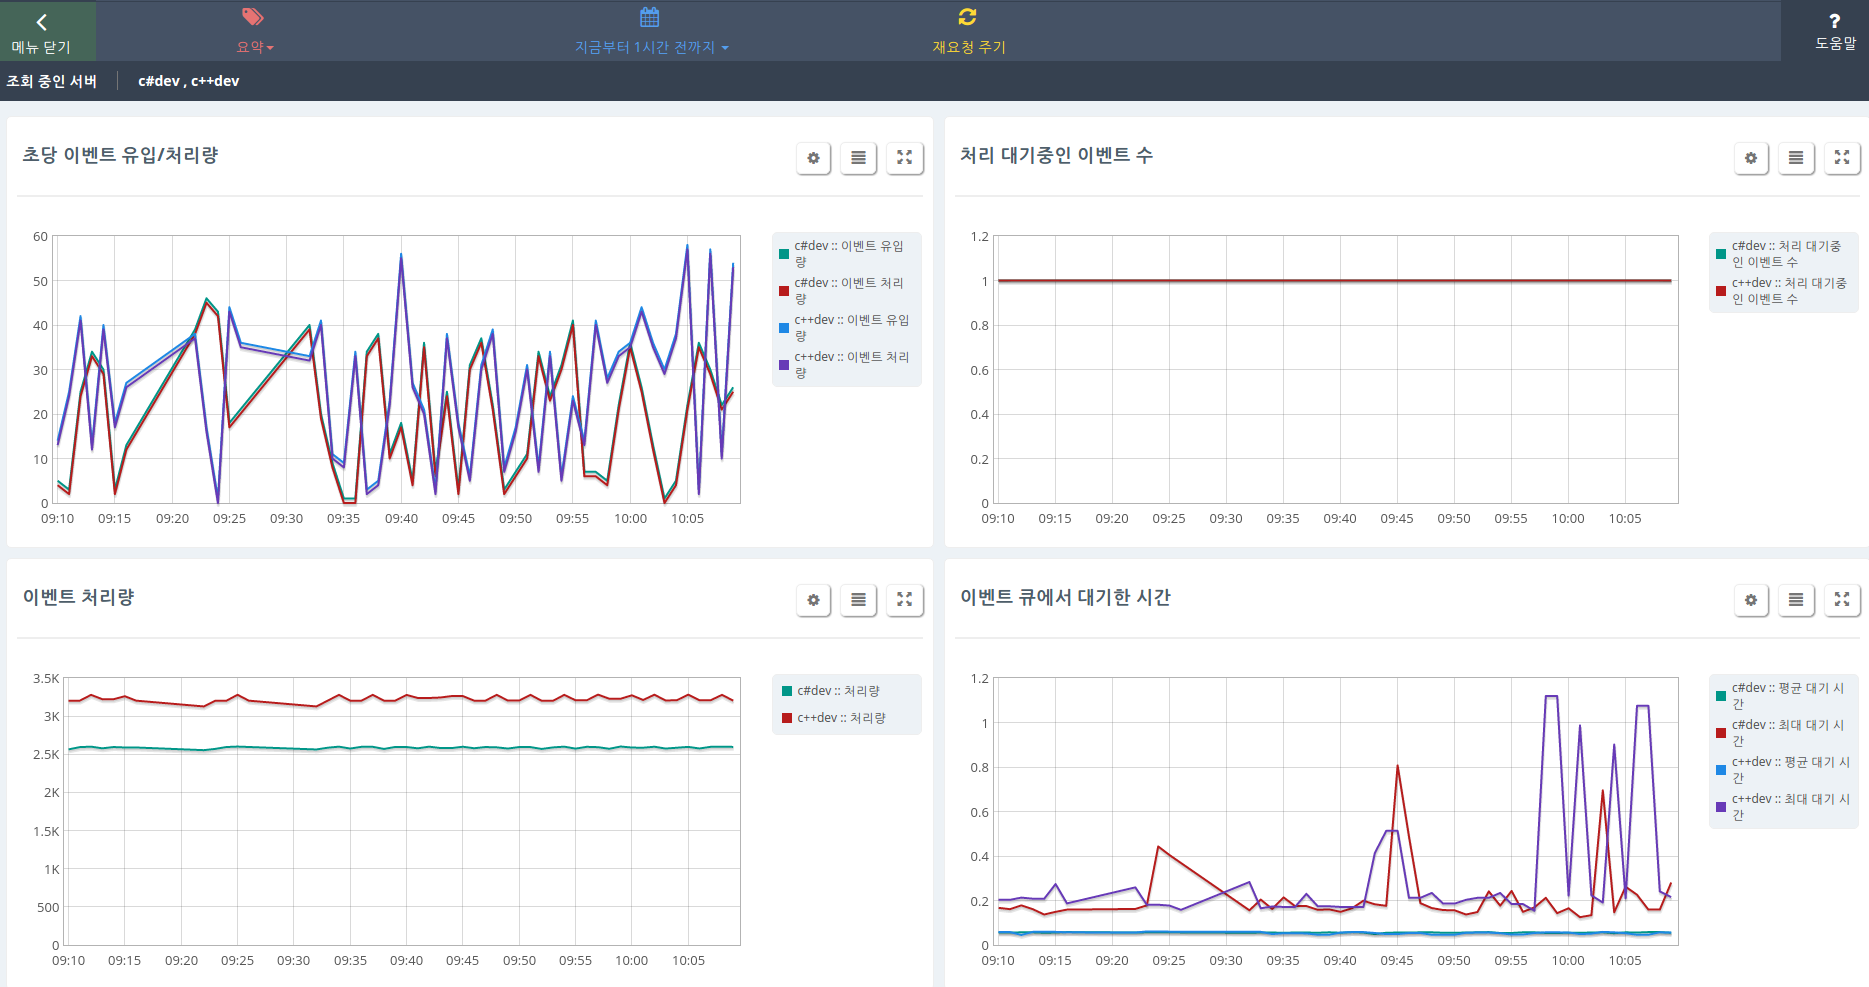
35.2.2. iFun Engine event performance monitoring
The number of events in iFun Engine per second, event handling speed, and changes in event queue length are displayed as graphs.
35.2.3. iFun Engine ORM performance monitoring
Each DB’s (shard DB if using sharding) reading/writing performance, number of read/write requests in queue, and number of ORM objects cached in memory are displayed as graphs.
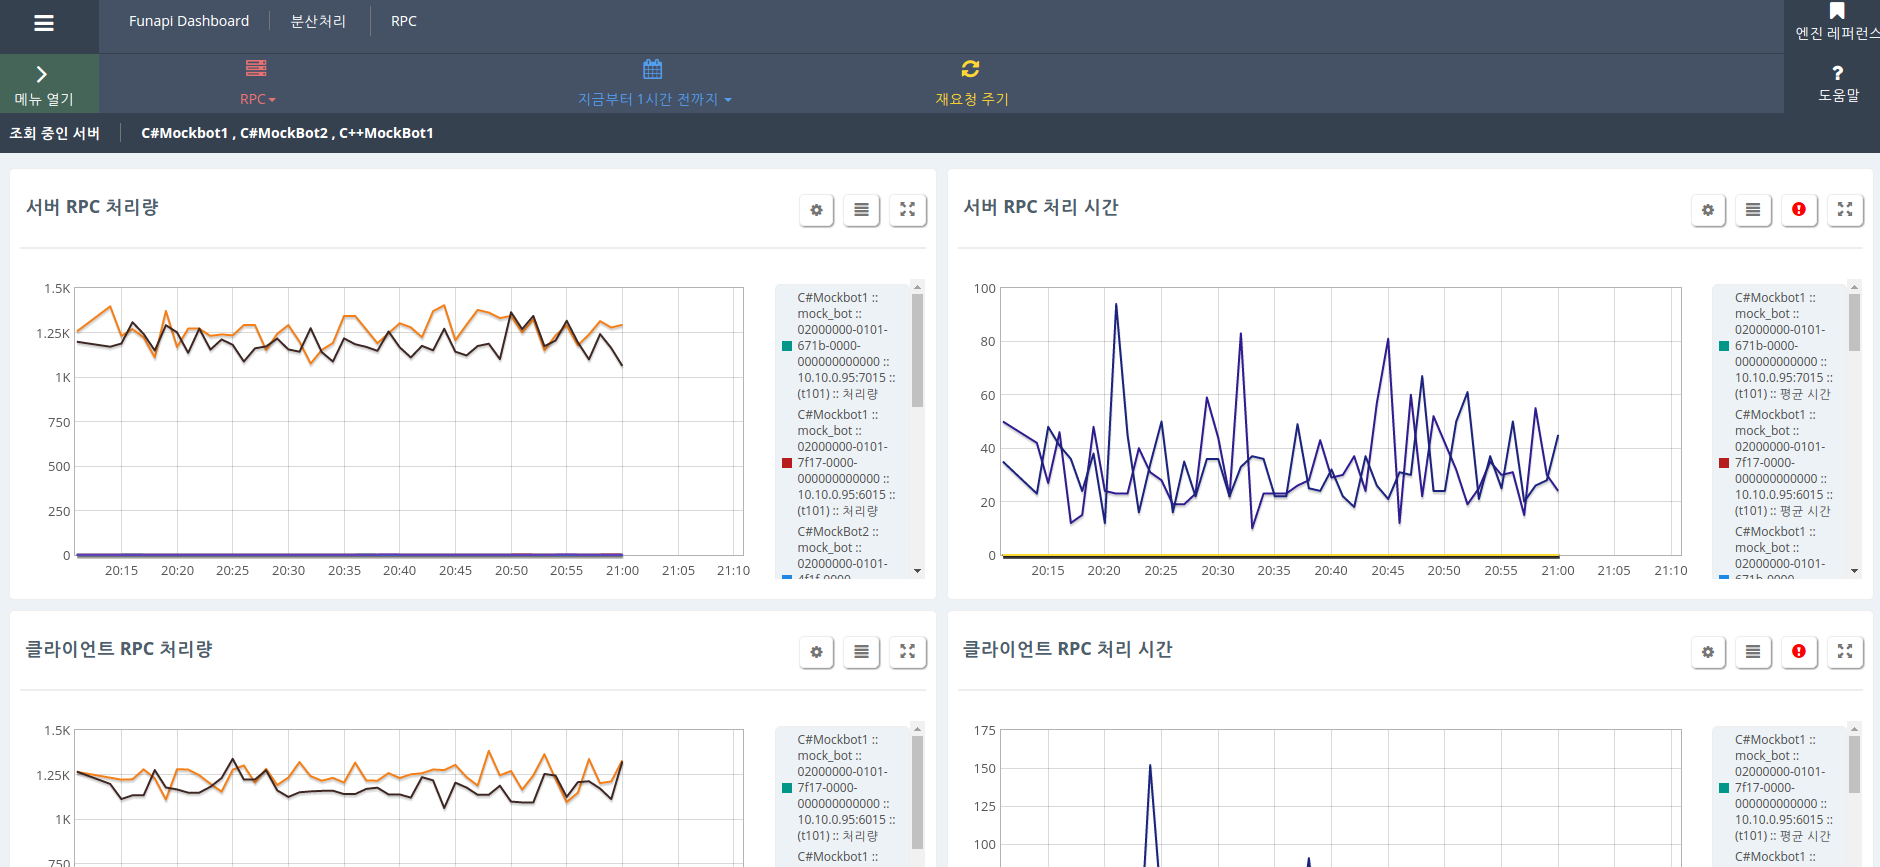
35.2.4. iFun Engine distribution performance monitoring
Displays RPC traffic used to communicate between servers as a graph.